
How to Analyze Your YCBM Booking Data with Claude (+Prompts)

Create your free booking page
You're probably already using Claude to draft emails, summarize documents, or think through a tricky decision. But your booking analytics? Still sitting in a spreadsheet you haven't opened in weeks.
What if we told you that you could take your YouCanBookMe (YCBM) booking data, drop it into Claude, and get real answers about:
- Which sessions are most popular?
- Which clients drive the most revenue?
- Where are people dropping off?
In this guide, we’ll walk you through exactly how to analyze your YCBM booking data with Claude. We’ll also share ready-to-use prompts you can copy, paste, and start using right away.
Before we dive in, here's what you'll need to follow along:
- A YouCanBookMe account on the Professional tier
- A Claude account (free or paid; both work)
- Your history of bookings—ideally 10 or more, though the more data you have, the richer the analysis
Your booking history lives in your YCBM dashboard, and exporting it takes less than a minute. Here's how:
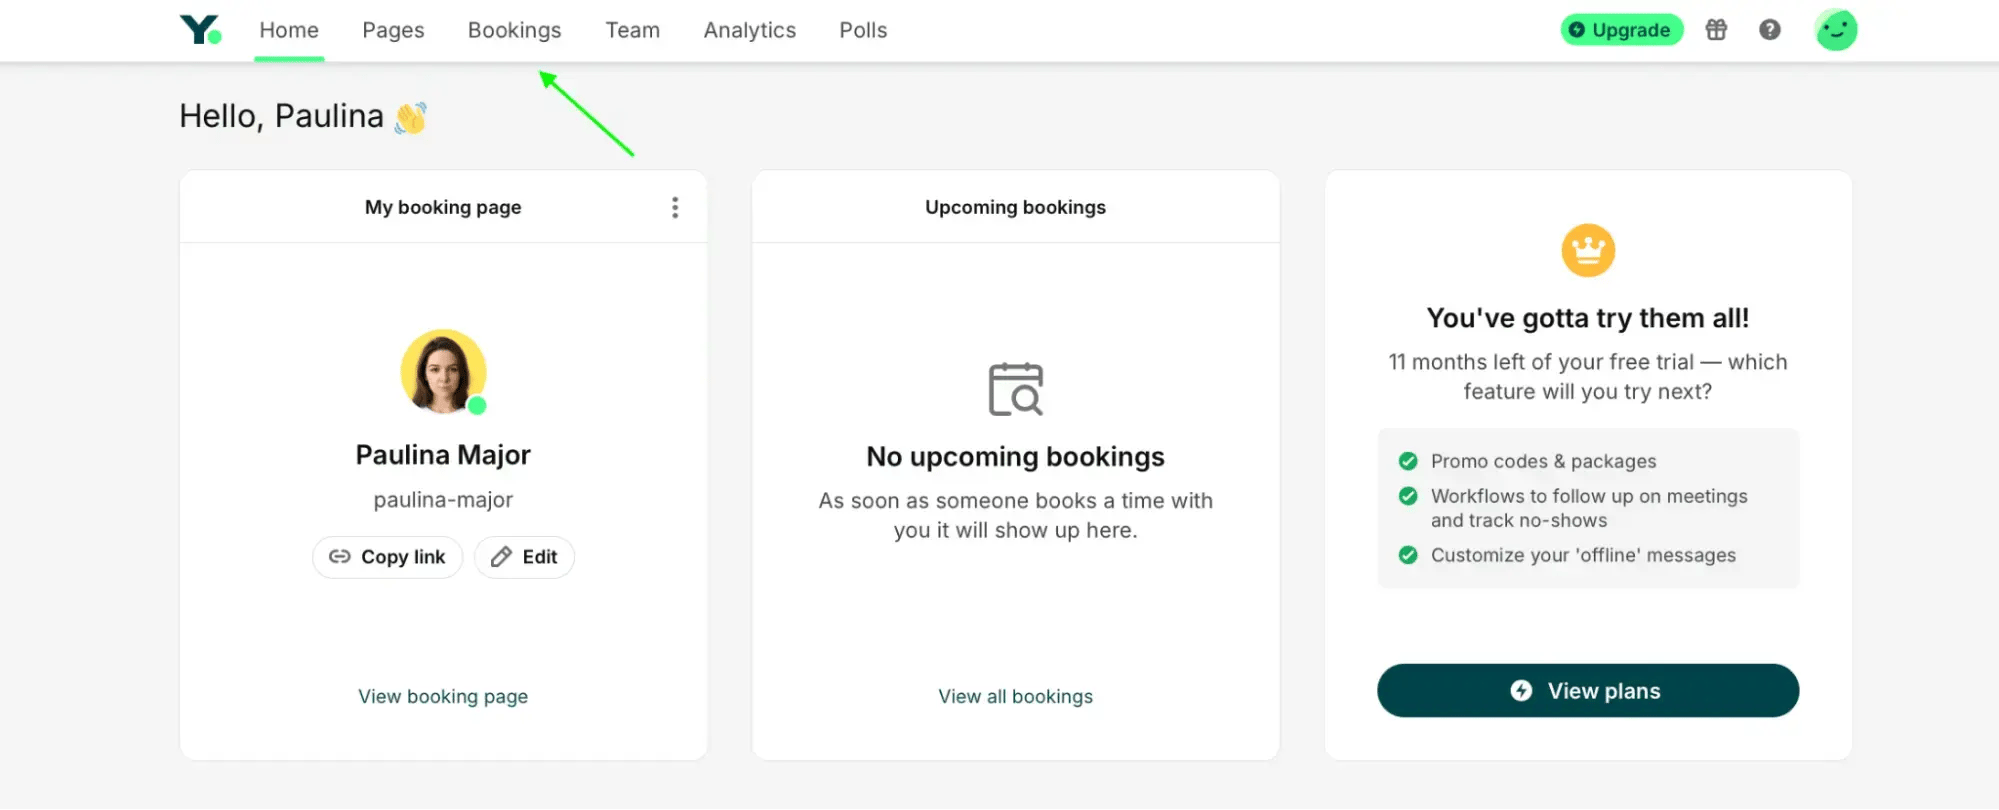
1. Log in to your YCBM account and click Bookings in the top menu.
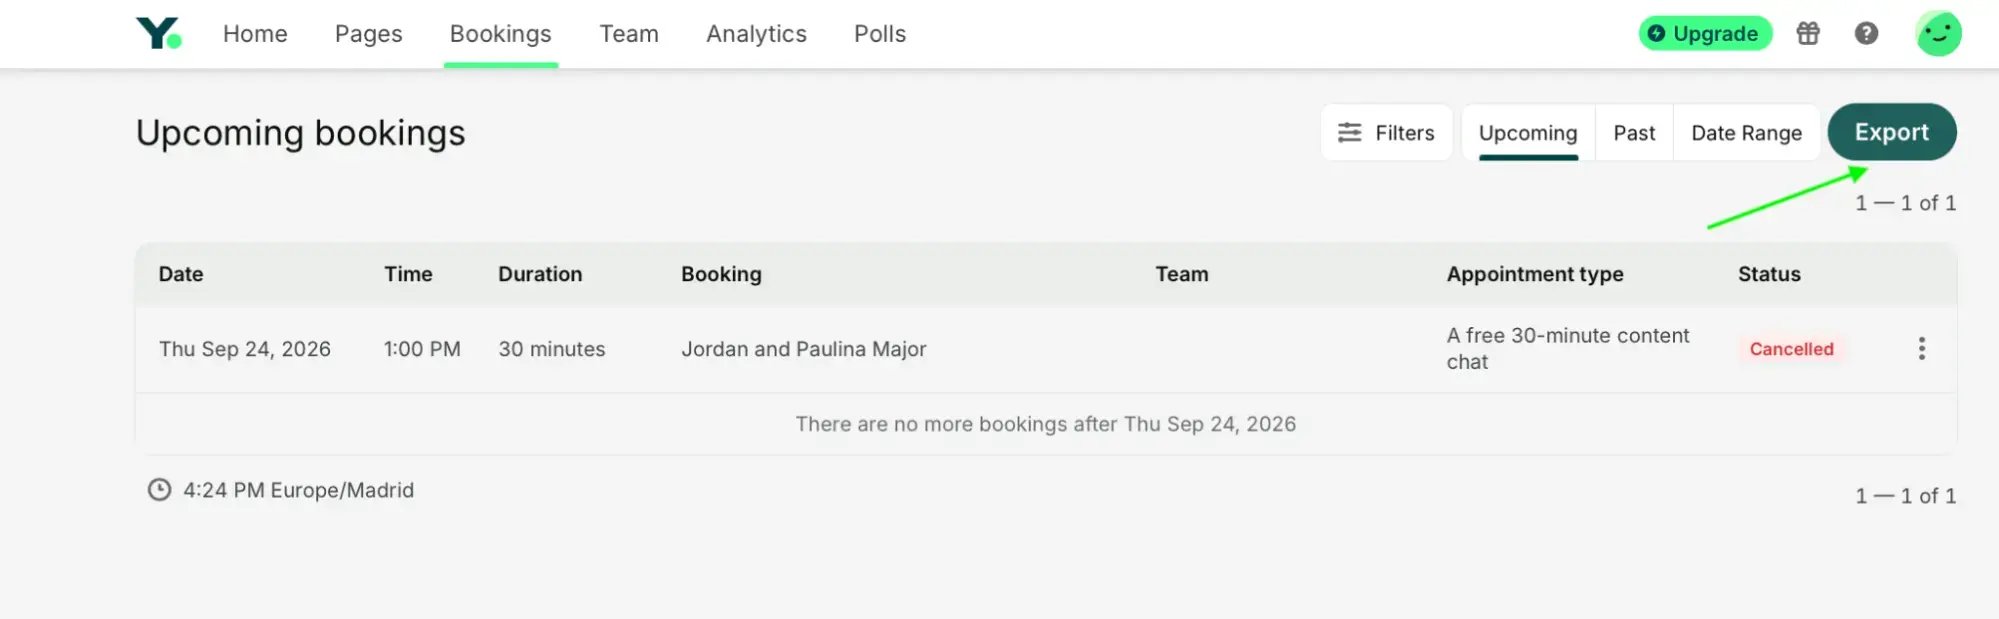
2. On the Bookings page, click Export in the upper-right corner.
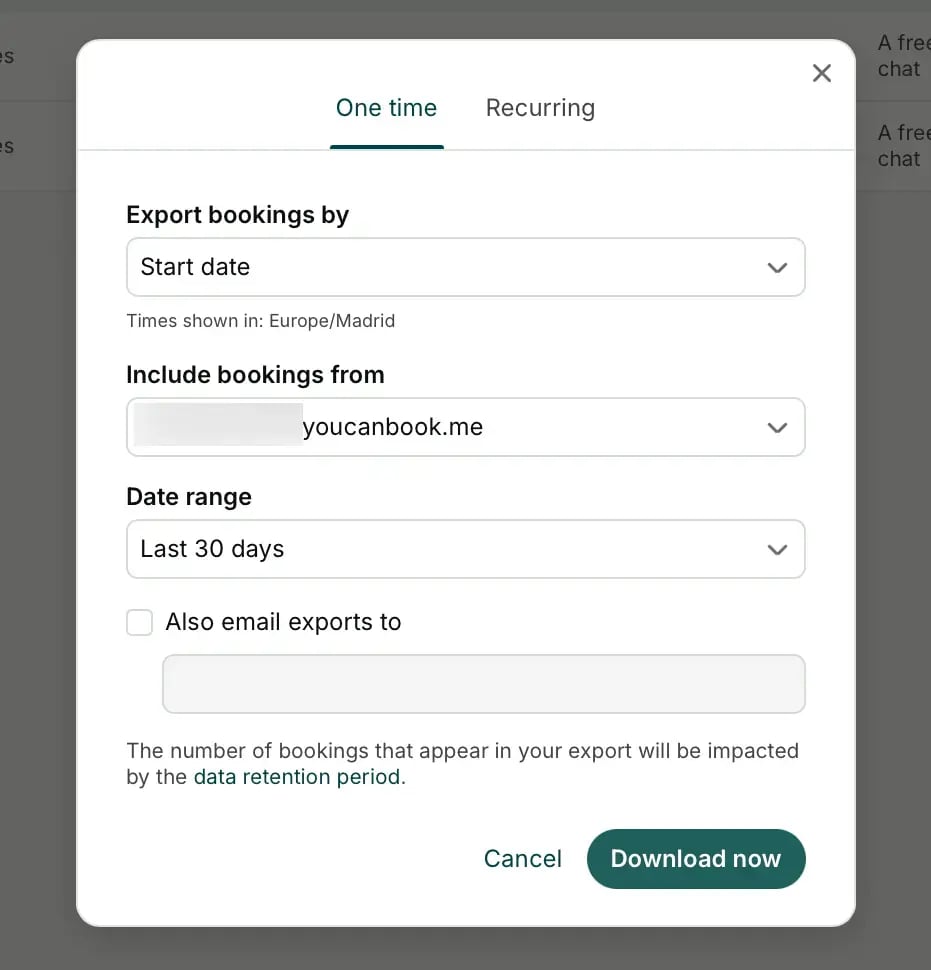
3. In the export window, choose One time to download your bookings now, or Recurring to set up regular exports. You can also choose whether to export bookings by their start date or another available date, select the booking page and date range, then click Download now to save the CSV file. You can also tick Also email exports to if you’d like a copy sent by email.
❗ A quick note on client data before you upload it: Claude processes what you give it, so treat it like you would any other third-party tool. Before uploading your CSV, take a moment to remove any personally identifiable information (PII), such as email addresses, phone numbers, and anything else you wouldn't want living outside your own systems.
What you can keep:
- First name
- Appointment type
- Booking source
- Price
- Booking status
- Any booking form responses (though read through these in case you ask for private information like a health card number)
That's more than enough for Claude to do its thing. To clean it up: open the file in Excel or Google Sheets, delete the columns you don't need, and hit save. It takes two minutes.
Alright, grab your exported spreadsheet, roll up your sleeves, and get cracking! In all honesty, there's just so much you can do with Claude once your booking data is in there.
In this guide, we'll share five examples of the kinds of questions you can answer. But by all means, go all in and experiment with different prompts to get even more insights out of your data.
First off, let's analyze your conversion funnel. Are your free intro calls actually leading to paid sessions? Which clients are making that jump?
If you offer a free consultation to bring new clients in, do you actually know how many of them turn into paying work? Most people have a rough feeling about it, but not a real number.
Try this prompt 👇
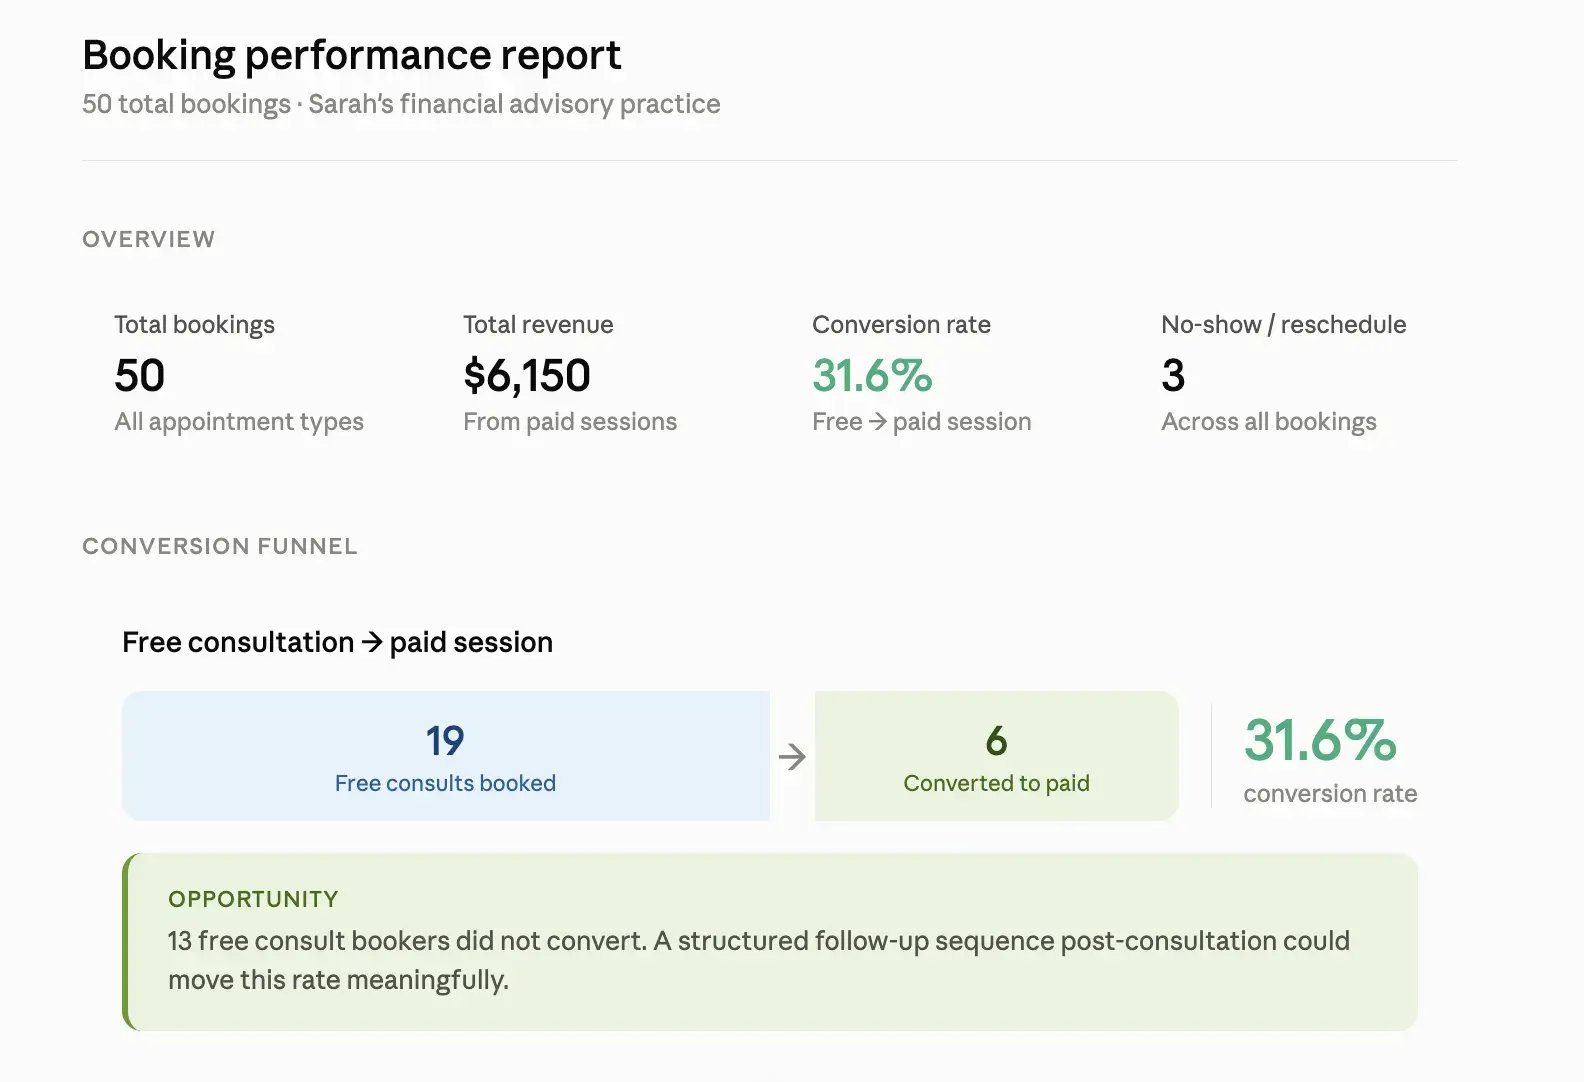
📊 What this unlocks for your business:
- Conversion rate visibility: You'll have a clear, quantifiable metric to track over time. This gives you a performance benchmark to measure the impact of any changes you make to your sales process, onboarding flow, or pricing strategy.
- Funnel leak identification: If prospects are entering the sales pipeline through your free consultation but not progressing to a paid engagement, you now have the data to pinpoint exactly where the drop-off is happening and address it with intention.
- A smarter follow-up strategy: Knowing which clients attended a free consultation but never converted gives you a targeted list to re-engage. Instead of sending generic follow-up emails to everyone, you can prioritize the right people with the right message at the right time.
Another interesting metric you should be looking at is your best-performing channels. These are the sources bringing clients to your calendar, whether that's social media, referrals, paid ads, or organic search.
But which one is actually bringing in the most bookings? And more importantly, which one is generating the most revenue? Those two answers aren’t always the same, and knowing the difference changes how you think about your marketing.
Try this prompt 👇
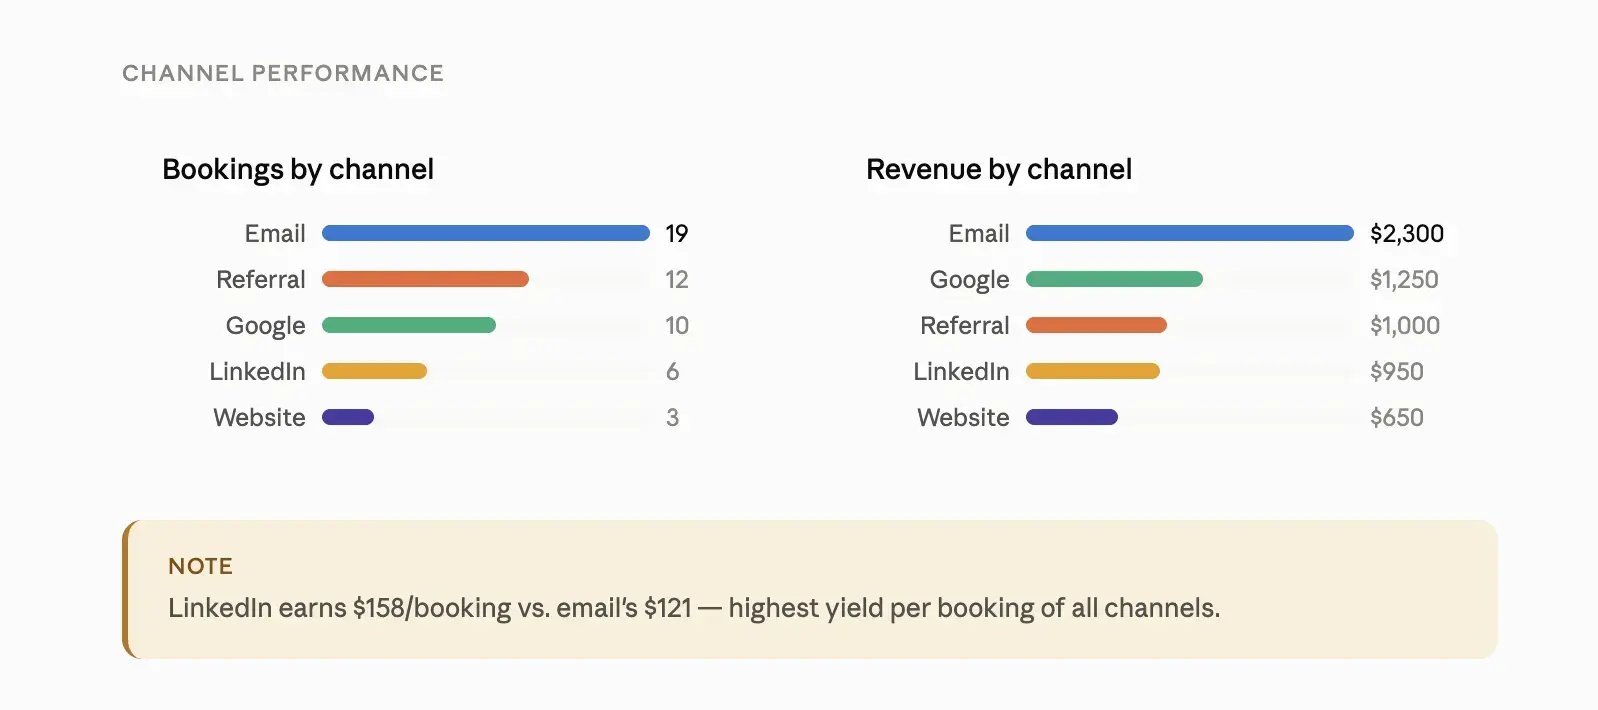
📊 What this unlocks for your business:
- Smarter marketing spend: When you know which channel delivers the highest return, you can double down on what's working and stop pouring budget into what isn't.
- Volume vs. value clarity: A channel bringing in lots of bookings isn’t necessarily your most profitable one. This analysis separates the two so you can make more strategic decisions about where to focus your acquisition efforts.
- A stronger growth strategy: Channel performance data gives you a factual foundation to build your marketing plan on, rather than relying on assumptions or vanity metrics.
If you offer multiple appointment types, which is pretty common in service-based businesses like salons, spas, or professional services like financial advisors and coaches, you probably want to know which ones are bringing in the most bookings and which ones are generating the most revenue.
Try this prompt 👇
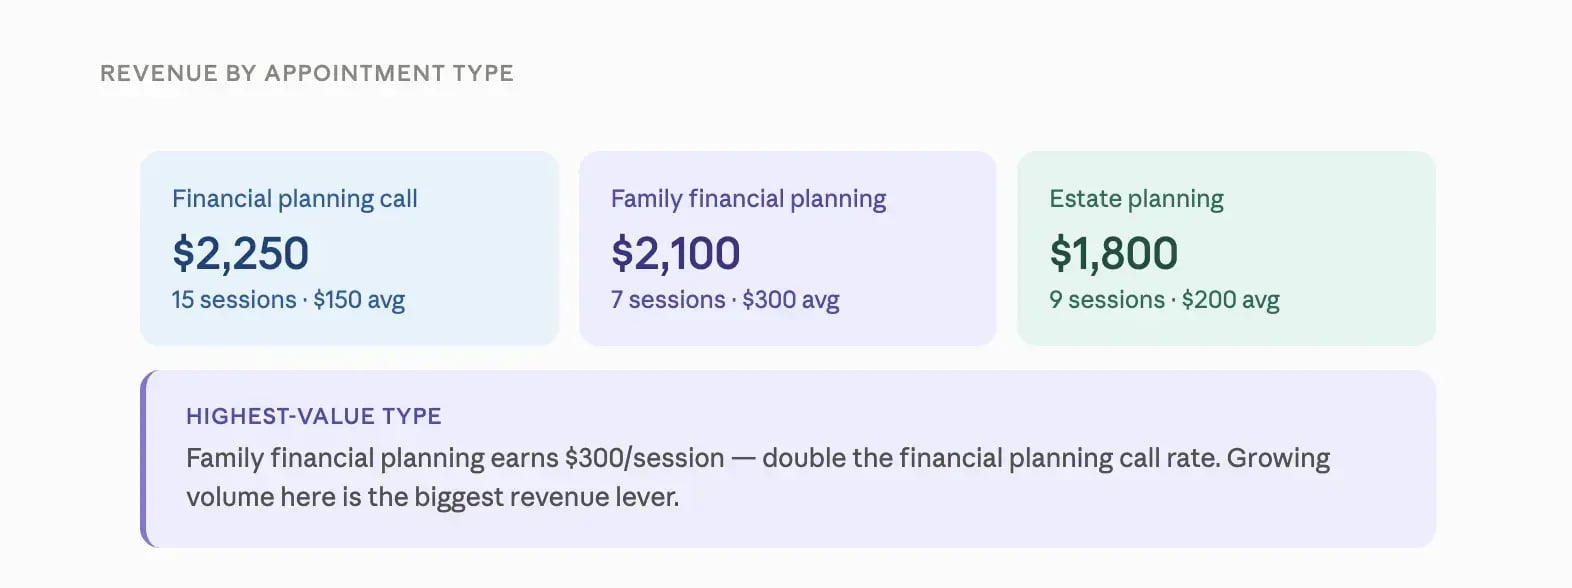
📊 What this unlocks for your business:
- Offer prioritization: Knowing which appointment types drive the most revenue helps you decide what to put front and center across your marketing campaigns and what to list first on your booking page.
- Smarter pricing decisions: If a session type has a high average booking value but low volume, it may need more promotion. Compare demand across your services before changing its price.
- A leaner, more profitable service menu: With clear revenue data by appointment type, you can make informed decisions about which offers to double down on and which ones to retire.
Raise your hand 🙋♀️ if you had a client who failed to show up for an appointment. No-shows and last-minute cancellations are one of the most frustrating parts of running a service-based business. They cost you time, disrupt your schedule, and eat into your revenue.
But do you know which appointment types are most prone to them? Identifying where the drop-off is happening is the first step to doing something about it.
Try this prompt 👇
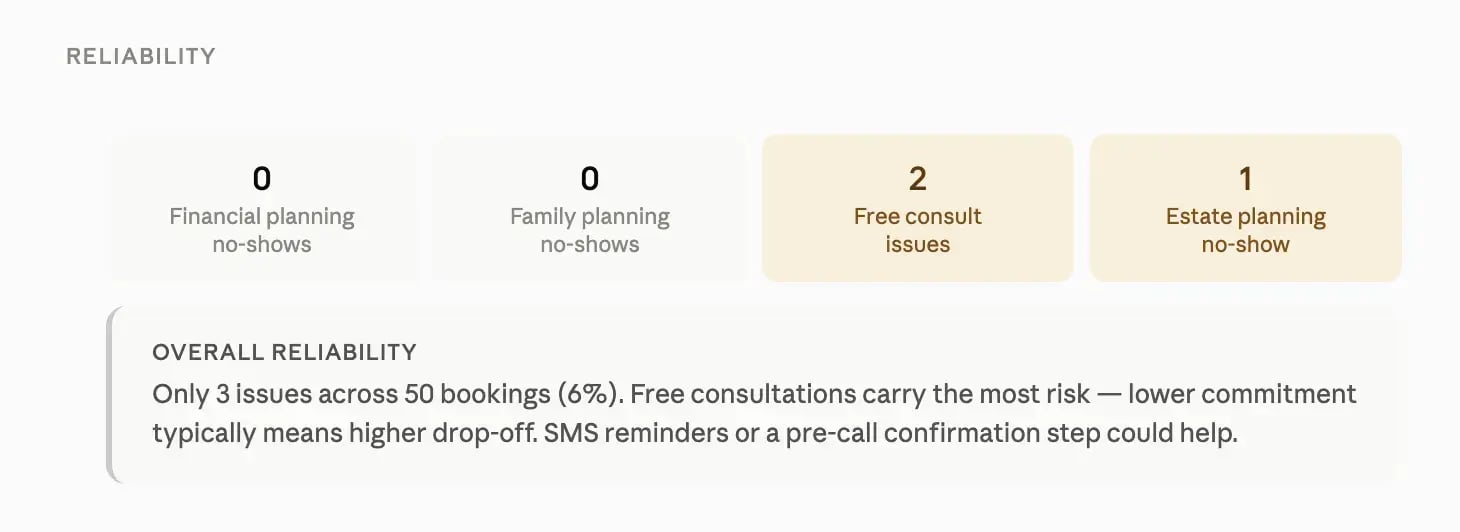
📊 What this unlocks for your business:
- Targeted retention efforts: Once you know which appointment types have the highest drop-off rate, you can introduce specific measures for those sessions, like an additional reminder or a deposit/upfront payment requirement.
- Revenue leakage visibility: Quantifying the percentage of bookings lost to cancellations and no-shows puts a real number on what it is costing your business, which makes it much easier to justify investing in a fix.
- Smarter scheduling policies: With the data in hand, you can build cancellation and rescheduling policies that are fair to clients but also protect your time and your bottom line.
If you have booking form questions, Claude can synthesize the responses across appointment types and surface the most common themes—no manual tagging required.
Try this prompt👇
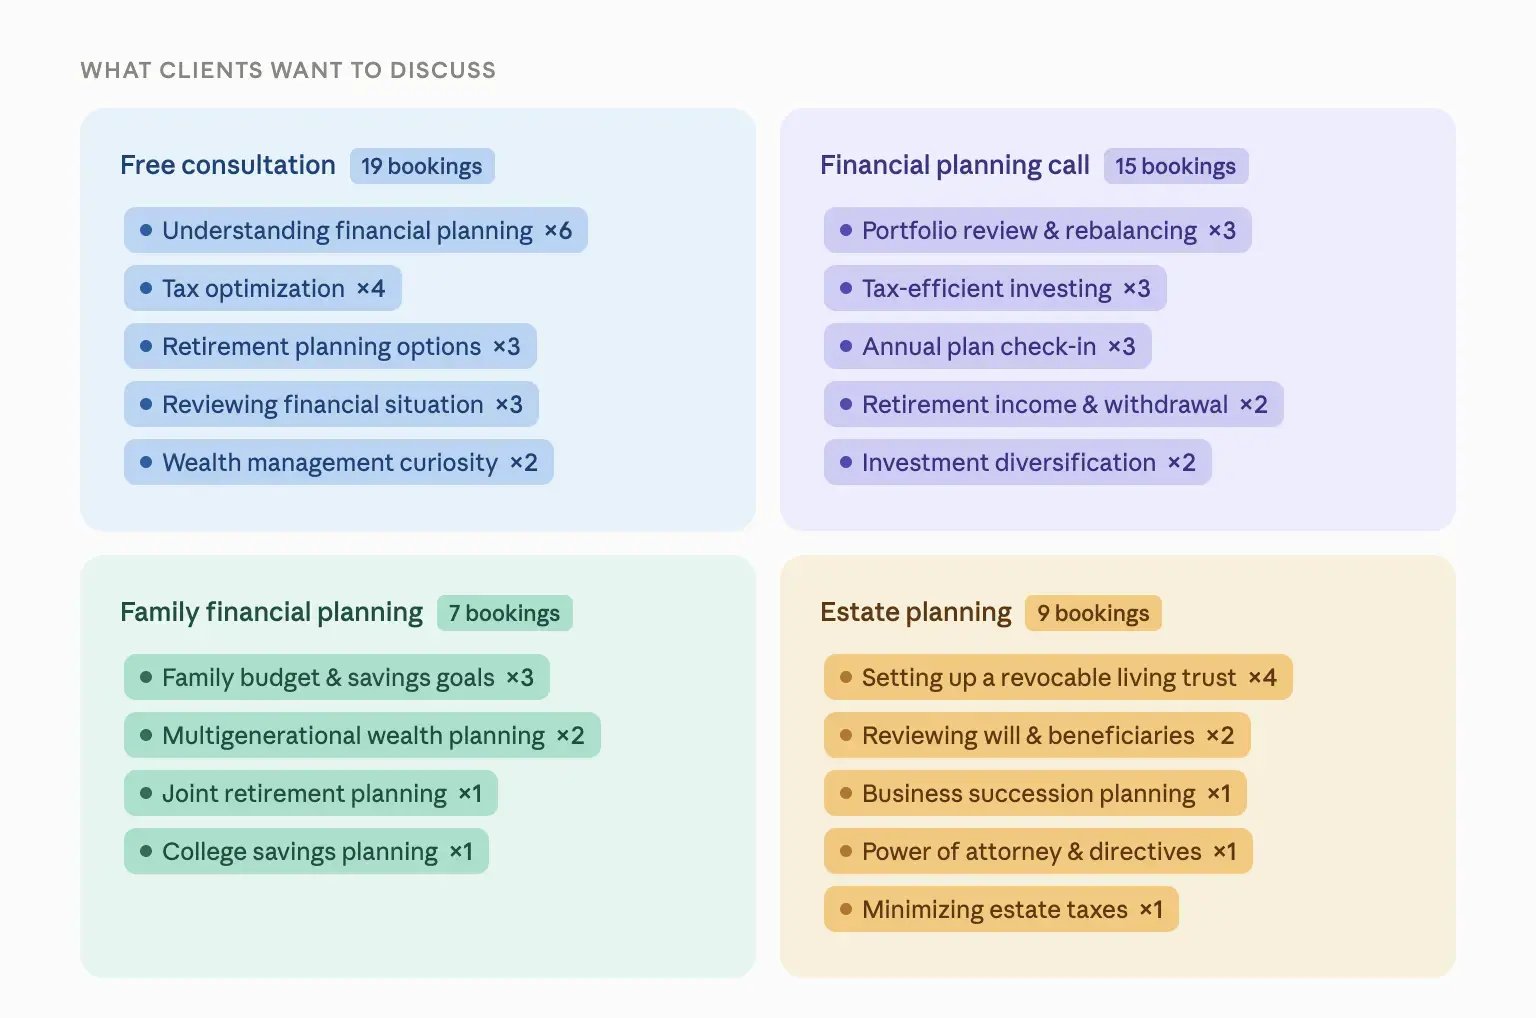
📊 What this unlocks for your business:
- Better meeting preparation: Knowing the most common reasons clients book each appointment type means you can show up more prepared and provide more personalized service from the very first call.
- A content strategy rooted in real demand: Your booking form responses are a direct window into what your audience cares about most. If a topic keeps coming up across multiple bookings, that’s a blog post waiting to be written, a YouTube video waiting to be recorded, or a lead magnet worth building.
- Smarter automation opportunities: When you spot recurring patterns in why clients book, you can set up automated sequences to get ahead of them. If a group of clients tends to come back for the same reason every year, why wait for them to remember to rebook? A timely, targeted email sequence can do that work for you.
After you’ve gone through the motions of analysis and getting your questions out of the way, try asking an open-ended question, like “Are there any other interesting data points worth calling out?” to see what else comes up.
In this case, here’s what we missed in our first round of analysis:
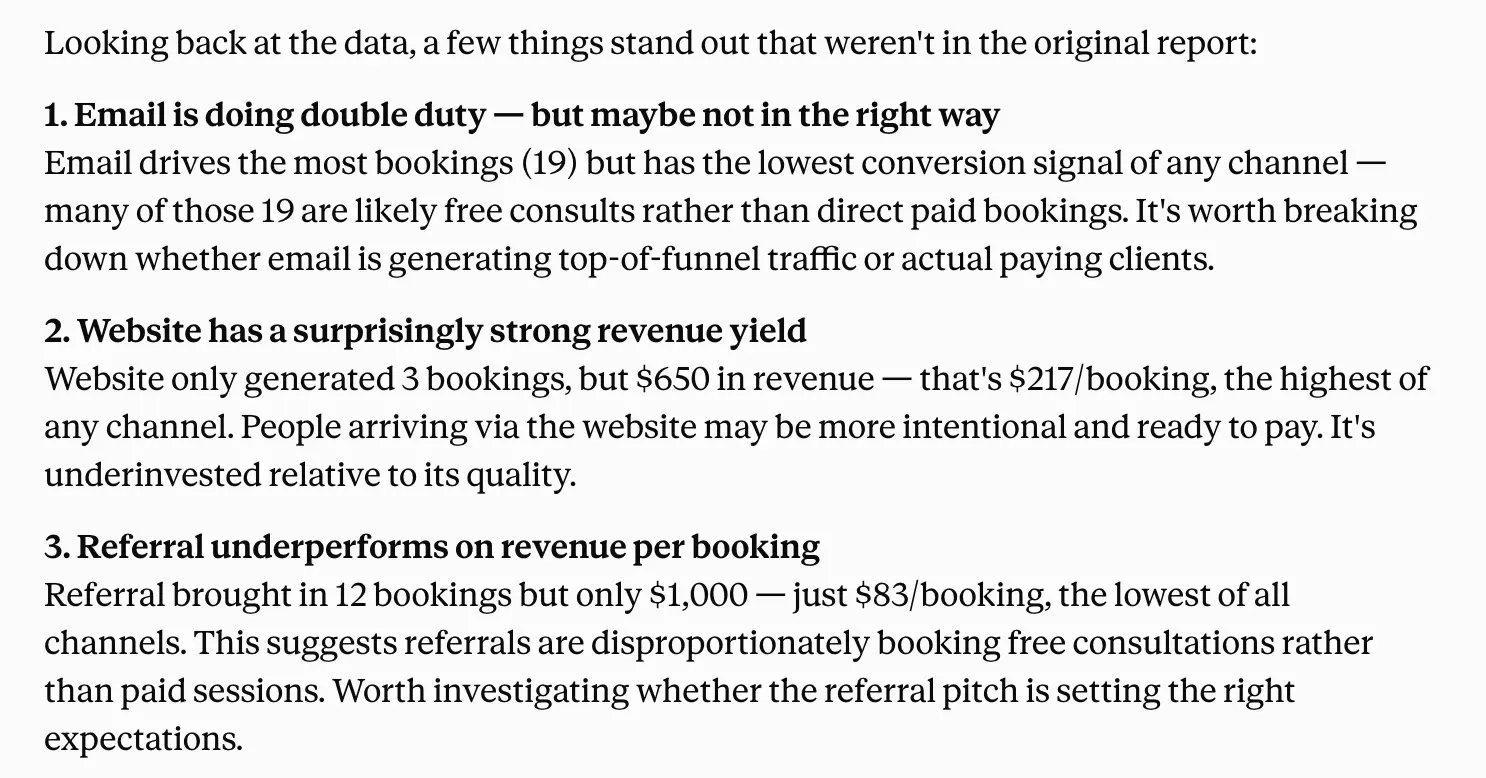
YouCanBookMe already has a solid set of native analytics that give you at-a-glance visibility into total bookings, team performance, and scheduling trends. For a quick read on how things are going, that’s your home base.
But when you pair it with Claude, you can take it a step further by uncovering channel conversion metrics, spotting patterns across booking form responses, and tracking trends over time—all on top of the scheduling data you are already collecting in YCBM.
Sounds good? Why don’t you give it a whirl?
- On the Free plan? → Explore Professional
- On the Professional plan? → Start analyzing your booking data

Written by
Paulina Major
Paulina Major is a freelance B2B content writer who has spent the last two years deep in the world of scheduling — writing about booking best practices, time management, and the tools that help small businesses run more efficiently. She writes from experience: as a solopreneur managing her own clients and calendar, she lives the challenges her readers are trying to solve.
Get started today
Join thousands of coaches, consultants, and entrepreneurs who use YouCanBookMe to power their business. Get your first booking in a few minutes.


 4.7 / 5 — Trustpilot

